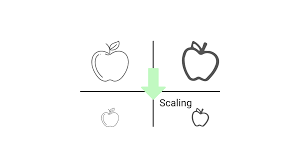
Feature Scaling
Understanding Feature Scaling: A Crucial Step for Optimizing Machine Learning Algorithms

Feature scaling is a data preprocessing technique that involves transforming the value of features or variables in a dataset to a similar scale. Feature scaling can vary your results a lot while using certain algorithms and have minimal or no effect on others. To understand this, let’s look at why features need to be scaled, the varieties of scaling methods and when we should scale our features.
What is Feature Scaling?
In other words, Feature Scaling is required for correct prediction and results. In case when the values of one of the columns are very high as compared to others, the impact of the column with a higher value will be much higher as compared to the impact of other low-valued columns. The feature with high magnitude will weigh a lot more than features having low magnitude even if they are more crucial in determining the output. Hence the prediction might not give the expected results and may fail to satisfy the business use case.
Feature Engineering is a big part of Data Science and Machine Learning. Feature Scaling is one of the last steps in the whole life cycle of Feature Engineering. It is a technique to standardize the independent features in data in a fixed range or scale. Once we are done with all the steps of feature engineering like encoding variables, handling missing values etc. then we scale all the variables to a very small of say -1 to 1 or 0 to 1. So all the data gets. Squeezed to decimal point b/w -1 and +1.
What it does it keep the distribution of the data the correlation and covariance the same however scales every independent or feature matrix column to a smaller scale we Do this as most of the ML algorithms problems perform significantly better after scaling
Why Should We Use Feature Scaling?
Some machine learning algorithms are sensitive to feature scaling, while others are virtually invariant. Let's explore these in more depth:
1. Gradient Descent Based Algorithms
Machine learning algorithms like linear regression, logistic regression, neural network, PCA (principal component analysis), etc., that use gradient descent as an optimization technique require data to be scaled.
"Having featured on a similar scale can help the gradient descent converge more quickly towards the minima.
2. Distance-Based Algorithms
Distance algorithms like KNN, K-means clustering, and SVM(support vector machines) are most affected by the range of features. This is because, behind the scenes, they are using distances between data points to determine their similarity.
For example, let’s say we have data containing high school CGPA scores of students (ranging from 0 to 5) and their future incomes (in thousands of Rupees):

Since both features have different scales, there is a chance that higher weightage is given to features with higher magnitudes. This will impact the performance of the machine learning algorithm; obviously, we do not want our algorithm to be biased towards one feature.
"Therefore, we scale our data before employing a distance-based algorithm so that all the features contribute equally to the result.

The effect of scaling is conspicuous when we compare the Euclidean distance between data points for students A and B, and between B and C, before and after scaling, as shown below:
Distance AB before scaling =>

Distance BC before scaling =>

Distance AB after scaling =>

Distance BC after scaling =>

3. Tree-Based Algorithms
Tree-based algorithms, on the other hand, are fairly insensitive to the scale of the features. Think about it, a decision tree only splits a node based on a single feature. The decision tree splits a node on a feature that increases the homogeneity of the node. Other features do not influence this split on a feature.
So, the remaining features have virtually no effect on the split. This is what makes them invariant to the scale of the features!
Types of Feature Scaling:
Feature Scaling is two types

These are further Divided.
Standardization:
- Standard Scaler
Normalization:
Min Max Scaling
Mean Normalization
Max Absolute Scaling
Robust Scaling etc.
What Is Normalization?
Normalization is a data preprocessing technique used to adjust the values of features in a dataset to a common scale. This is done to facilitate data analysis and modelling and to reduce the impact of different scales on the accuracy of machine learning models.
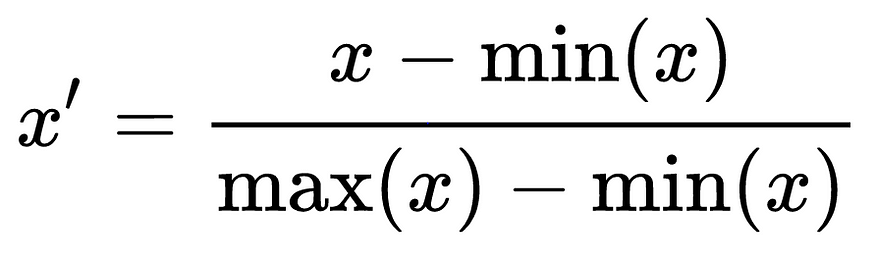
Normalization is a scaling technique in which values are shifted and rescaled so that they end up ranging between 0 and 1. It is also known as Min-Max scaling.
Here’s the formula for normalization:
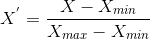
Here, Xmax and Xmin are the maximum and minimum values of the feature, respectively.
When the value of X is the minimum value in the column, the numerator will be 0, and hence X’ is 0
On the other hand, when the value of X is the maximum value in the column, the numerator is equal to the denominator, and thus the value of X’ is 1
If the value of X is between the minimum and the maximum value, then the value of X’ is between 0 and 1
What Is Standardization?
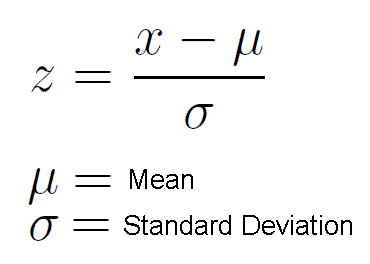
Standardization is another scaling method where the values are centred around the mean with a unit standard deviation. This means that the mean of the attribute becomes zero, and the resultant distribution has a unit standard deviation.
Here’s the formula for standardization:


is the mean of the feature values and

is the standard deviation of the feature values. Note that, in this case, the values are not restricted to a particular range. Now, the big question in your mind must be when should we use normalization and when should we use standardization? Let’s find out!
The Big Question – Normalize or Standardize?
| Normalization | Standardization |
| Rescales values to a range between 0 and 1 | Centres data around the mean and scales to a standard deviation of 1 |
| Useful when the distribution of the data is unknown or not Gaussian | Useful when the distribution of the data is Gaussian or unknown |
| Sensitive to outliers | Less sensitive to outliers |
| Retains the shape of the original distribution | Changes the shape of the original distribution |
| May not preserve the relationships between the data points | Preserves the relationships between the data points |
| Equation: (x – min)/(max-min) | Equation: (x – mean)/standard deviation |
STANDARD SCALER
Standard scaler is one of the most used feature scaling methods and it assumes your data is normally distributed within each feature and will scale them such that the distribution is now centred around 0, with a standard deviation of 1.
Let’s take a look at it in action:
Import packages
import pandas as pd
import numpy as np
from sklearn import preprocessing
import matplotlib
import matplotlib.pyplot as plt
import seaborn as sns
%matplotlib inline
matplotlib.style.use('ggplot')
We are going to develop custom data using Numpy
np.random.seed(1)
df = pd.DataFrame({
    'x1': np.random.normal(0, 2, 10000),
    'x2': np.random.normal(5, 3, 10000),
    'x3': np.random.normal(-5, 5, 10000)
})
Perform feature scaling
scaler = preprocessing.StandardScaler()
scaled_df = scaler.fit_transform(df)
scaled_df = pd.DataFrame(scaled_df, columns=['x1', 'x2', 'x3'])
Plot using Matplotlib
fig, (ax1, ax2) = plt.subplots(ncols=2, figsize=(6, 5))

ax1.set_title('Before Scaling')
sns.kdeplot(df['x1'], ax=ax1)
sns.kdeplot(df['x2'], ax=ax1)
sns.kdeplot(df['x3'], ax=ax1)
ax2.set_title('After Standard Scaler')
sns.kdeplot(scaled_df['x1'], ax=ax2)
sns.kdeplot(scaled_df['x2'], ax=ax2)
sns.kdeplot(scaled_df['x3'], ax=ax2)
plt.show()
Let’s see a graphical representation of our features before and after scaling.
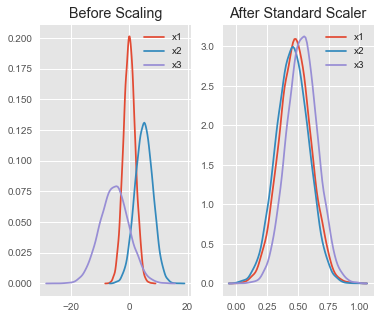
Right here you can see that no features dominate each other. Feature scaling enables positive model accuracy.
With this point of mine, I am sure I have been able to convict you and not confuse you that feature scaling is important and necessary in building a successful model😊
Normalization
MinMaxScaling(a commonly used normalization technique) is one of the feature scaling techniques, it transforms features by subtracting from the minimum value of the data and dividing by (maximum minus minimum).
Formula for MinMaxScaling
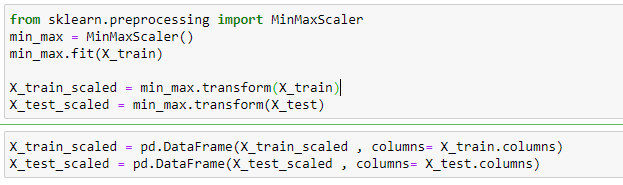
So now we have seen the formula min-max scaling, Now we shall look at how it can be applied to our dataset.
Description of the dataset:
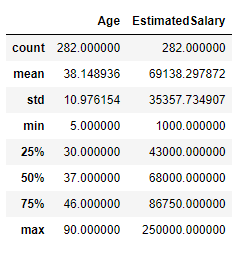
describe the data before min-max scaling
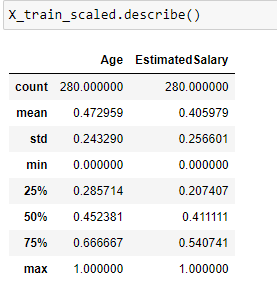
Note that the minimum value of both the input features Age and Estimated Salary has become 0 and the maximum value has become 1 after applying MinMax scaling.
Effect on Distribution of the data:
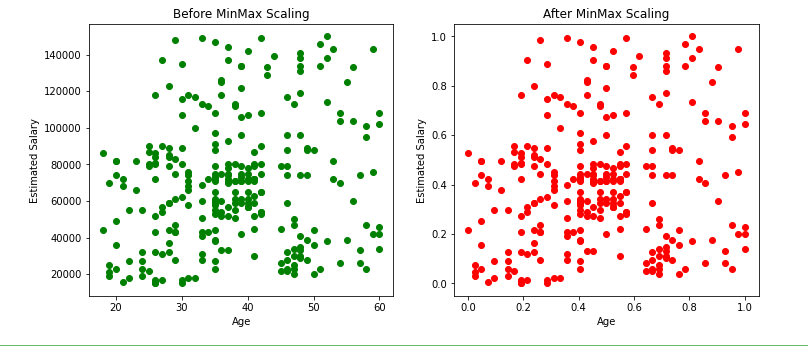
Effect of scatter plot before and after Min-Max scaling
From the above scatter plots and KDE plots we can note that the distribution of the data remains the same even after applying the min-max scaler, only the scale changes.
Effect of Normalization on different Machine Learning algorithms:
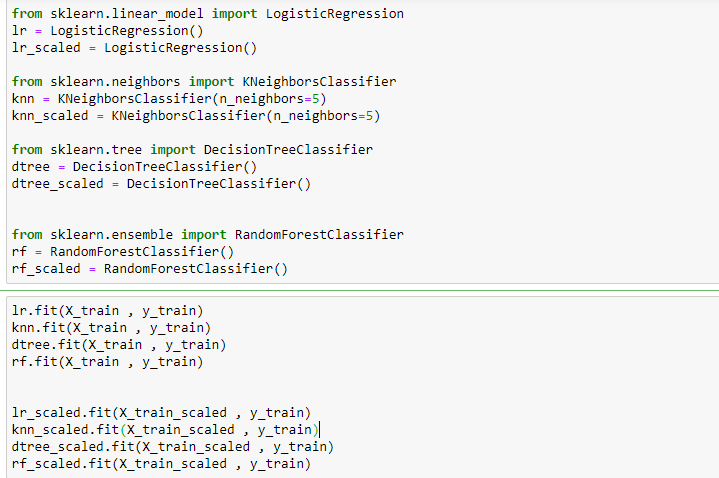
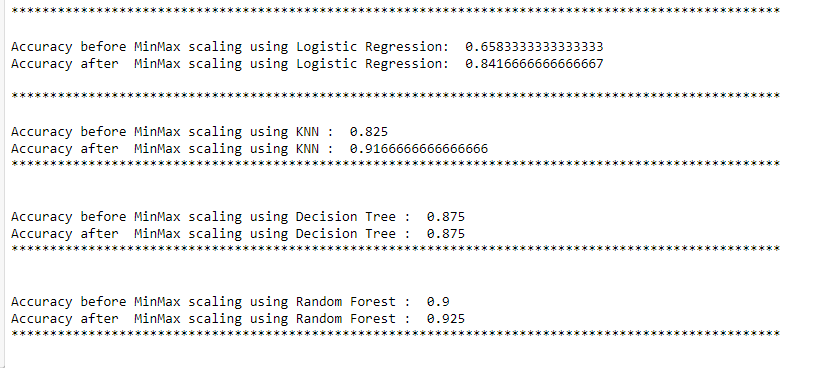
Effect on accuracy
In the above examples, the accuracy of Logistic regression and KNN increased significantly after scaling. But there was no effect on accuracy when the decision tree or random forest was used.
Effect on outliers:
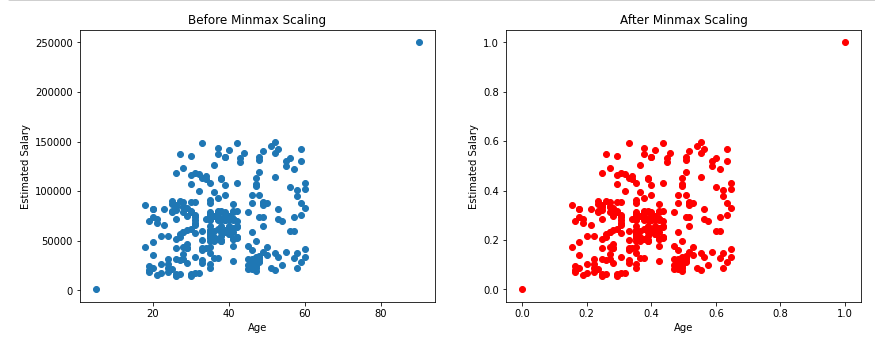
Effect of normalization on outliers.
As shown above, there will not be any effect on outliers even after applying min-max scaling.
Observations:
The resulting data after standardization will have a mean of 0 and a standard deviation of 1, whereas the resulting data after min-max scaling will have a minimum value as0 and a maximum value of 1 (Here the mean and standard deviation can be anything).
The scatter plots and KDE plots above show that there will be no change in the distribution of data before and after applying the standard scaler or min-max scaler, only the scale changes.
The feature scaling step has to be performed while applying algorithms where distance gets calculated (Eg: KNN, KMEANS) and involves gradient descent (Eg: Linear and Logistic regressions, neural networks).
There will not be any effect of scaling when we use tree-based algorithms like decision trees or random forests.
In the above examples, the accuracy of Logistic regression and KNN increased significantly after scaling. But there was no effect on accuracy when the decision tree or random forest was used.
Outliers in the dataset will still remain an outlier even after applying the feature scaling methods, as data scientists, it is our responsibility to handle the outliers.
There is no hard rule to tell which technique to use, but we need to check both standardization and normalization and decide based on the result which one to use.